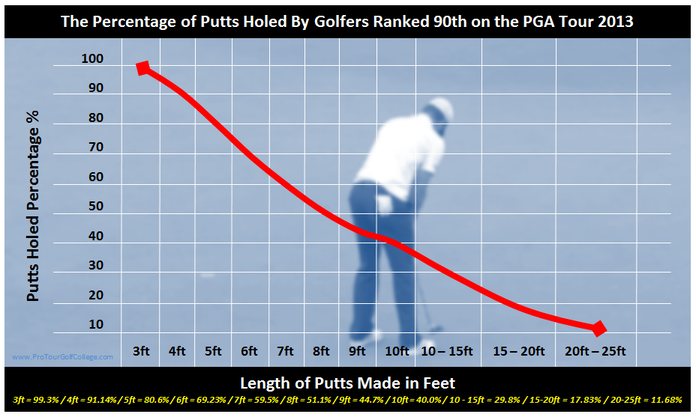
"Too often elite golfers focus much of their energy on improving technical competency without looking at whether they are strong enough in planning and strategic thinking and thoughts and emotions under pressure."  In my last article I showed you how to evaluate your 4 primary performance categories that will help you to identify, isolate and ultimately improve your golf skills so you can build and sustain competitive advantage on the pro tour. In today’s article I’m going to take it one step further by showing you how to dig much deeper into your game using some very simple and easy to use tools to isolate the specific sub category skills that will help you to score better and more consistently in tournaments. By now you have identified your weakest-most important performance category out of putting, short-game, approach shots and driving ranked them from 1 to 4. By evaluating these 4 categories with the help of the 3 primary resources of technical competency, tactical competency and temperamental competency (that influence every performance on the golf course) you can zero in on specific types of strokes that will drive your golf score average down. Unfortunately all too often elite golfers focus too much of their energy on just improving technical competency without looking at whether they are strong enough in planning and strategic thinking and thoughts and emotions under pressure. So to become a competitive force on a pro tour you will need to become excellent in all 3 resource areas because these key resources affect your playing and performance when it counts. How to Dig Deep to Discover the Gold in Your Game Let’s say that you have ranked putting as your weakest ability out of the 4 and you want to improve your putting performances in tournaments. Where would you start first, and how would you know what to work on? Well, any tour or serious amateur golfer that truly cares about their performances on the golf course and has a strong desire to get better will have up to date statistics on their putting performances from short putts to long putts and everything in between. Take a look at the image below and you can see the results for golfers ranked 90th on the PGA Tour for the 2013 season for putts ranging from 3 feet to 10 feet, and also 10 to 15 feet, 15 to 20 feet and 20 to 25 feet. I'm sure that you would agree that it certainly makes it easier to identify putting strengths and weaknesses when you can see your results in all these distance categories?
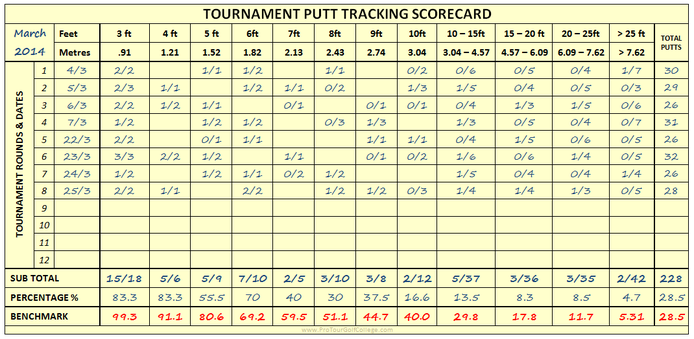
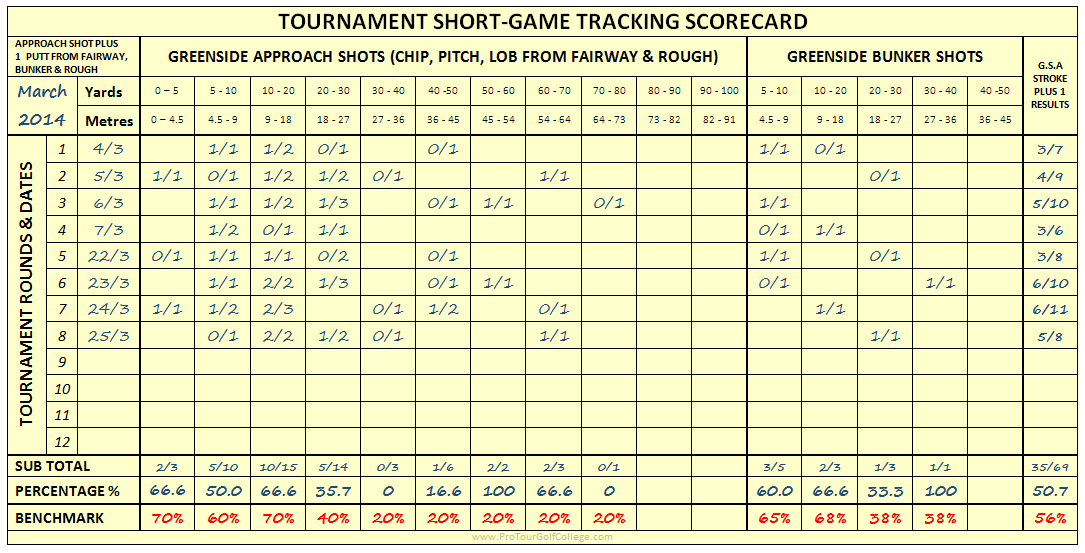
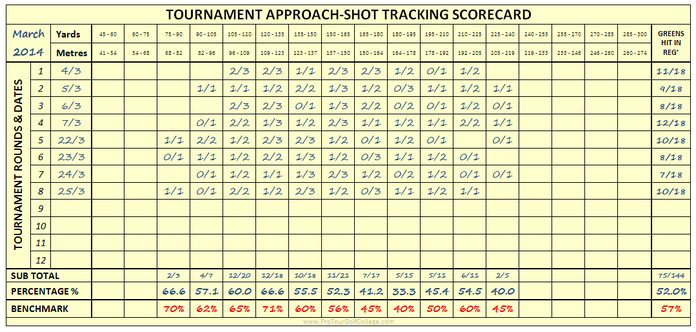
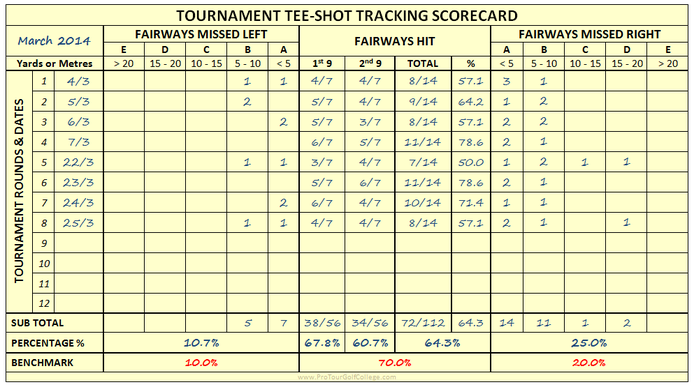
"What are your weakest-most important distances? These are the distances that when you improve them you increase your pars made average, your birdie or better average, and you decrease your bogey and worse average on tour." The Shot Tracking Scorecard Take a good look at our putt tracking scorecard below and notice in the example that our golfer has tracked his putts over 8 tournament rounds and bench-marked his putting performances against PGA Tour golfers who ranked 90th in distances from 3 feet to putts greater than 25 feet. Now admittedly you would sample more than 8 tournament rounds (12 or more is better), but for this example even with 8 rounds you can see how effective and simple it is to track and identify specific putting distances that you might be weak at with our shot tracking scorecard. The beauty of using this simple scorecard is that you are able to track different distances in your rounds to identify your strongest to weakest putt distances. Then you can compare or benchmark your results against players on the PGA Tour or another pro tour to see where you need to improve. Whenever you need to dig a little deeper into your game you simply bring out the scorecard and use it over 12 rounds to track your shots to find out whats going on. Statistical Relevance = More Pars and Birdies and Less Bogeys and Worse The key to improvement in the sub-skill categories is to identify the relevant statistics and then decide on the type of strokes you need to learn and/or improve that help you to make more pars and birdies and less bogeys and worse. We find that quite ironic when it comes to tour players compiling statistics that they often don’t see that improvement in a statistical category should increase their pars and better made percentage and reduce the bogeys and worse average. Its simply not enough to just improve a particular statistic (and hope you improve your score average) unless you can connect to an improvement in pars and birdies made etc. Take a look at the image below of our golfers short-game results over the same 8 tournament rounds and again you can see that we have very specific data on how effective this golfer is from a range of green-side distances out to 100 yards. Benchmark to Boost Results The bench-marks on the bottom of the scorecard are added so our golfer can not only track his results but also aim for a specific amount of improvement (within a defined time frame), and by doing this he knows how effective he is at getting the ball into the hole with his chip, pitch, lob and bunker shots from various distances in less strokes. All the bench-marks he has established are fractionally better than his current performances over the various distances, and with different types of strokes, and in the example we are looking for roughly 5 percent improvement - except when the result is zero where he aims at 20 percent. You can see how much better this approach is compared to just being able to say that you achieved a scrambling (stroke plus 1) result over 8 rounds of 50.7 percent. You will also notice that even where he has achieved 100 percent in a specific distance category, that he still bench-marks it based on the results that he wants to achieve over a longer period. For example he might be aiming to achieve a 20 percent improvement from 50 to 60 yards within 12 weeks even though he is currently at 100 percent, because he knows that 20 percent is more realistic in his first improvement phase. Track, Measure and Manage to Improve The best thing about tracking your shots on the golf course is that it takes away most of the guess work which makes it easier to work with your instructor or coach to plan for long-term improvement. How can you establish benchmarks if you don't know how good you truly are from one distance to the next? Unless I'm mistaken this game is built around distance and accuracy...You improve golf scores by improving the strokes that influence better scores. And it always gets down to the same things; improving your distance and direction control to improve your scores. Greens Hit in Regulation Tracking Greens hit in regulation in the approach shot category is another area where you might already know that your greens in regulation statistic is 52 percent for example but what you might not know is that your 180 to 195 yard range is weak (33.3%), and that you make more bogeys from this range than other distances. So let's say that you want to improve your 33.3 percent result and move it to your 40 percent benchmark in 3 months. By digging deeper into your results using the approach shot tracking scorecard you can isolate and then determine whether stroke competency is the problem, or possibly your strategy at this distance could be changed to help you to produce better results. Or maybe your stroke, strategy and confidence is fine but you simply don't practice this distance enough to improve it? Whatever you determine it to be you can now work on it more effectively with the help of your instructor to improve it. You Don't Drive For Show, You Drive For Results How about your tee-shot effectiveness, how good do you drive the ball from the tee? In the example below you can see that our golfer achieved a 64.3 percent result hitting his tee-shots into the fairway, but the best part of the analysis is not how many fairways he hit, but where his ball went when he missed the fairway. Our tee-shot tracking scorecard tracks the amount of distance the tee-shot misses the fairway by which will help you to identify where your high score average originates. Notice that of the 112 tee-shots he hit that 25 percent of his tee-shots went to the right and only 10 percent went left? You can also see that 14 of the tee-shots that went to the right are within 5 yards of the edge of the fairway, but another 14 missed between 5 and 20 yards further right which could mean that many of these shots were in deep rough or behind trees and making it more challenging to make pars and better, and it probably increased the likelihood of making bogeys and worse. Work On One Category at a Time I'm sure you are starting to see that it is much easier to understand and improve any area of your game when you track and measure your shots to manage your improvement. And keep in mind that you don't have to use all the scorecards at once because the idea is to work on one part of your game at a time - especially when you are playing tournaments because you have very little time to work on your game when you are on the road. It is better to compile the information whilst you are playing tournaments and then work on making the improvement when you get home where you have the time to work hard on the identified weaknesses away from distraction. Put your email address in the cell opposite the red arrow and press the "CLICK HERE" button and you will receive your links to your FREE tracking and training templates within 60 minutes.
Comments are closed.
|
Archives
June 2019
|
Proudly Supported By
Copyright © 2011 - 2018 Pro Tour Golf College
Website Managed By Golf Performance Media
All Rights Reserved
Website Managed By Golf Performance Media
All Rights Reserved




 RSS Feed


